One Sample T-test (two-sided)
This app permits visualization of the relationship between Confidence intervals and p values.
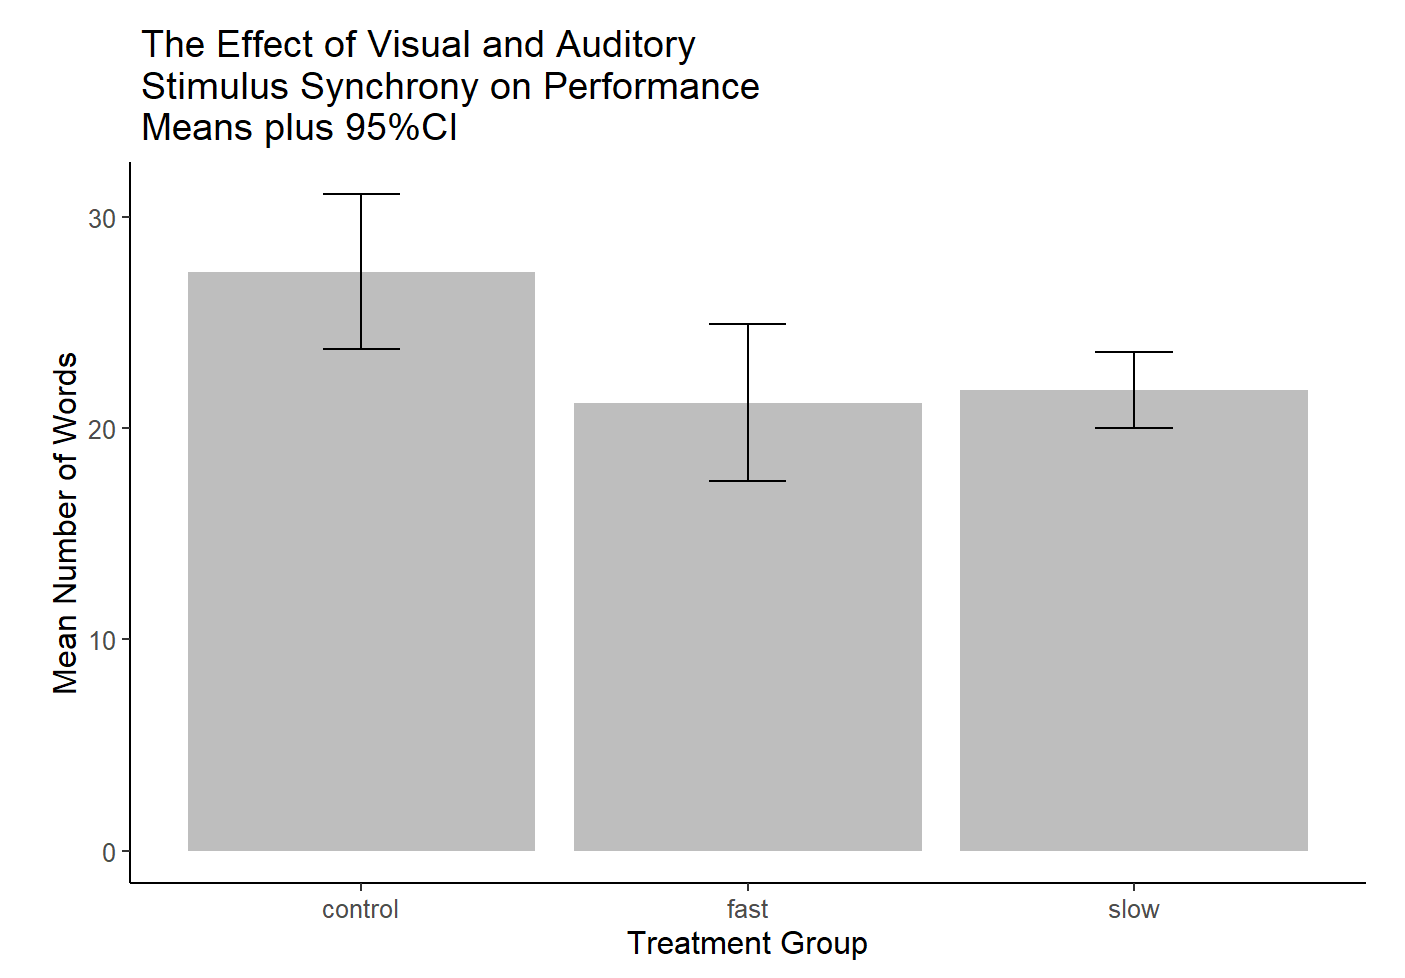
There is a well-known inaccurate perception among students/researchers that in
comparing two conditions, if CI’s overlap that means that a test of the mean difference
in the two conditions will not be significant with NHST procedures at the same alpha level
as the CI is specified. The misunderstanding is often applied in situations where
comparisons between pairs of groups are done visually using a graph such as this
bar graph displaying means and CI’s.
\(\bullet\) The misunderstanding probably arises because such a relationship Does exist in tests of means in the standard 1-sample t-test.
\(\bullet\) Comparisons of CI overlap and p values can be made for many different statistics, but here, the focus is on tests of means, the most common application where this confusion arises.
\(\bullet\) In this app, we can visualize the CI-overlap idea in a one-sample test of means (the standard one-sample t-test) and in the independent samples t-test (pooled variance form). A related plot, based on suggestions from Gardner and Altman is also provided.
\(\bullet\) A literature on which the app is based is found in the references tab. The two-sample depiction was motivated by plots and ideas from Cumming and Baguley and a literature on “inference by eye”. The Gardner Altman plots use the “dabestr” package in R.
The user is advised to work through each tab, in order.
Shiny app by
Bruce Dudek
\(\bullet\) When the mean of a single sample is compared to a null hypothesis value, the standard NHST inferential method is the one-sample t-test.
\(\bullet\) In this limited 1-sample situation, overlap of the CI with the null hypothesis mean value always coincides with a non-significant t-test.
\(\bullet\) The overlap/pvalue relationship occurs when the CI level is \(1-\alpha\) for the two-tailed t-test.
\(\bullet\) The plot permits comparison of various hypothetical sample mean values with a fixed null hypothesis value.
\(\bullet\) The simulated data comprise a random sample of 15 scores with a standard deviaiton of 15 and the sample mean is chosen in the plot controls.
\(\bullet\) Comparison of means from two independent samples is traditionally done with the independent samples t-test.
\(\bullet\) The data for this plot are simulated so that the std deviations within each of the two groups are exactly 15 (homogeneity of variance).
\(\bullet\) The t-test employed is the 'pooled variance' form but produces the same test outcome as the Welch form since n's are equl in the two groups (15) and within group variances are identical.
\(\bullet\) The user can manipulate the CI level and the size of the mean difference between the two groups.
\(\bullet\) CI levels can be chosen as one of three fixed values - the .83 level produces CIS that just abut when the p value is exactly .05
\(\bullet\) Caveat: When heterogeneity of variance or unequal sample sizes are present, the relationship betwen p values and CI overlap as visualized here may be slightly different.
\(\bullet\) Explore this plot to visualize the relationship between CI overlap and p value.
\(\bullet\) Choose the CI level and mean difference value to explore the relationship.
\(\bullet\) Add graph elements with the checkboxes to include more visualizations and numeric information.
\(\bullet\) The right hand pane displays the value of the difference between the two group means and the CI displayed there is the CI of the difference, derived from the standard error of the difference.
\(\bullet\) The CI of the difference behaves with a relationsip to p values in a manner identical to a 1-sample test, but the CIs for each individual mean have overlap patterns that don't show that same relationship.
Two Sample T-test (two-sided):
\(\bullet\) A style of graph recommended by Gardner and Altman (see references).
\(\bullet\) This visualization also examines the two independent samples situation.
\(\bullet\) It focuses on the difference value between the group means or an effect size coefficient.
\(\bullet\) Overlaps of the CI with the zero difference value or zero effect size are not perfectly coincident with p value significance since the CIs here are bootstrapped.
\(\bullet\) This type of plot forces an emphasis on estimation over 'significance'.
\(\bullet\) Gardner and Altman style plot (see references).
\(\bullet\) The left panel shows the raw data for two independent groups - same simulation as the CI visualization in the 2-sample tab.
\(\bullet\) The right had panel is in the scale of the difference between the two means or one of two effect sizes.
\(\bullet\) The CI in the right hand panel is a CI for the mean difference, but it is bootstrapped, not the asymptotic estimate of the two-sample t-test.
\(\bullet\) Note that bootstrapped CI's may not give same visual outcome as shown in the 2-sample panel plots.
\(\bullet\) The gray shaded distribution is a simulted sampling distribution of the difference, based on the bootstrapped SD.
\(\bullet\) The plots may load somewhat slowly due to the bootstrapping methodology
\(\bullet\) This plot uses the 'dabestr' package in R.
The very useful dabestr package in R creates the Gardner-Altman style plots and is described here:
Ho J, Tumkaya T, Aryal S, Choi H, Claridge-Chang A (2019). “Moving beyond P values: Everyday data analysis with estimation plots.” doi: 10.1038/s41592-019-0470-3, https://rdcu.be/bHhJ4.
https://cran.r-project.org/web/packages/dabestr/index.html
Work in this app is based on the following literature:
References
Altman, D., Machin, D., Bryant, T., & Gardner, M. (2013). Statistics with confidence: confidence intervals and statistical guidelines. John Wiley & Sons.
Austin, P. C., & Hux, J. E. (2002). A brief note on overlapping confidence intervals. Journal of vascular surgery, 36(1), 194-195.
Baguley, T. (2012). Serious stats : a guide to advanced statistics for the behavioral sciences. Palgrave Macmillan.
Belia, S., Fidler, F., Williams, J., & Cumming, G. (2005). Researchers Misunderstand Confidence Intervals and Standard Error Bars. Psychological Methods, 10(4), 389-396. https://doi.org/http://dx.doi.org/10.1037/1082-989X.10.4.389
Bolker, B. (2015). Overlapping confidence intervals. https://rstudio-pubs-static.s3.amazonaws.com/132971_a902bb2b962b407e9e9436559c6f5d36.html
Cumming, G. (2007). Inference by eye: Pictures of confidence intervals and thinking about levels of confidence. Teaching Statistics, 29(3), 89-93.
Cumming, G. (2009). Inference by eye: reading the overlap of independent confidence intervals. Statistics in medicine, 28(2), 205-220.
Cumming, G., Fidler, F., & Vaux, D. L. (2007). Error bars in experimental biology. J Cell Biol, 177(1), 7-11. https://doi.org/10.1083/jcb.200611141
Cumming, G., & Finch, S. (2005). Inference by eye: confidence intervals and how to read pictures of data. Am Psychol, 60(2), 170-180. https://doi.org/10.1037/0003-066X.60.2.170
Cumming, G., Williams, J., & Fidler, F. (2004). Replication and Researchers' Understanding of Confidence Intervals and Standard Error Bars. Understanding Statistics, 3(4), 299-311. https://doi.org/http://dx.doi.org/10.1207/s15328031us0304_5
Finch, S., & Cumming, G. (2009). Putting research in context: understanding confidence intervals from one or more studies. J Pediatr Psychol, 34(9), 903-916. https://doi.org/10.1093/jpepsy/jsn118
Franz, V. H., & Loftus, G. R. (2012). Standard errors and confidence intervals in within-subjects designs: generalizing Loftus and Masson (1994) and avoiding the biases of alternative accounts. Psychon Bull Rev, 19(3), 395-404. https://doi.org/10.3758/s13423-012-0230-1
Gardner, M. J., & Altman, D. G. (1986). Confidence intervals rather than P values: estimation rather than hypothesis testing. British medical journal (Clinical research ed.), 292(6522), 746-750. https://doi.org/10.1136/bmj.292.6522.746
Goldstein, H., & Healy, M. J. (1995). The graphical presentation of a collection of means. Journal of the Royal Statistical Society: Series A (Statistics in Society), 158(1), 175-177.
Ho, J., Tumkaya, T., Aryal, S., Choi, H., & Claridge-Chang, A. (2019). Moving beyond P values: data analysis with estimation graphics. Nat Methods, 16(7), 565-566. https://doi.org/10.1038/s41592-019-0470-3
Julious, S. A. (2004). Using confidence intervals around individual means to assess statistical significance between two means. Pharmaceutical Statistics: The Journal of Applied Statistics in the Pharmaceutical Industry, 3(3), 217-222.
Knezevic, A. (2008). Overlapping confidence intervals and statistical significance. StatNews: Cornell University Statistical Consulting Unit, 73(1).
Marmolejo-Ramos, F., & Matsunaga, M. (2009). Getting the most from your curves: exploring and reporting data using informative graphical techniques. Tutor. Quant. Methods Psychol, 5, 40-50.
Masson, M. E. J. (2004). “Using confidence intervals for graphically based data interpretation”: Correction to Masson and Loftus (2003). Canadian Journal of Experimental Psychology/Revue canadienne de psychologie expérimentale, 58(4), 289. https://doi.org/http://dx.doi.org/10.1037/h0087451
Masson, M. E. J., & Loftus, G. R. (2003). Using confidence intervals for graphically based data interpretation. Canadian Journal of Experimental Psychology/Revue canadienne de psychologie expérimentale, 57(3), 203-220. https://doi.org/http://dx.doi.org/10.1037/h0087426
Morrison, G. R., & Weaver, B. (1995). Exactly how many p values is a picture worth? A commentary on Loftus’s plot-plus-error-bar approach. Behavior Research Methods, Instruments, & Computers, 27(1), 52-56.
Noguchi, K., & Marmolejo-Ramos, F. (2016). Assessing Equality of Means Using the Overlap of Range-Preserving Confidence Intervals. The American Statistician, 70(4), 325-334. https://doi.org/10.1080/00031305.2016.1200487
Payton, M. E., Greenstone, M. H., & Schenker, N. (2003). Overlapping confidence intervals or standard error intervals: what do they mean in terms of statistical significance? Journal of Insect Science, 3(1).
Payton, M. E., Miller, A. E., & Raun, W. R. (2000). Testing statistical hypotheses using standard error bars and confidence intervals. Communications in Soil Science and Plant Analysis, 31(5-6), 547-551.
Ryan, G. W., & Leadbetter, S. D. (2002). On the misuse of confidence intervals for two means in testing for the significance of the difference between the means. Journal of Modern Applied Statistical Methods, 1(2), 56.
Schenker, N., & Gentleman, J. F. (2001). On Judging the Significance of Differences by Examining the Overlap Between Confidence Intervals. The American Statistician, 55(3), 182-186. https://doi.org/10.1198/000313001317097960
Wolfe, R., & Hanley, J. (2002). If we're so different, why do we keep overlapping? When 1 plus 1 doesn't make 2. Cmaj, 166(1), 65-66.
Wright, T., Klein, M., & Wieczorek, J. (2018). A Primer on Visualizations for Comparing Populations, Including the Issue of Overlapping Confidence Intervals. The American Statistician, 73(2), 165-178. https://doi.org/10.1080/00031305.2017.1392359